


I’ve previously posted on the subject of correlations to league success. In that post I used NCAA volleyball data to look at how the major reported related to how a team did in their conference. As you can see from the table below, Hitting Efficiency [ (Kills-Errors)/Total Attempts ] had the highest correlation to match wins, with Kills/Set not far behind. Aces/Set and Blocks/Set are lower, and Digs/Set comes last.

In a similar timeframe, Kyle from SoloStats did his own analysis using matches from a variety of levels entered using that platform. Here is a slide from a presentation he put together about his observations. It’s one of a few showing multiple different levels of play. You can find the whole slide deck on the linked page.
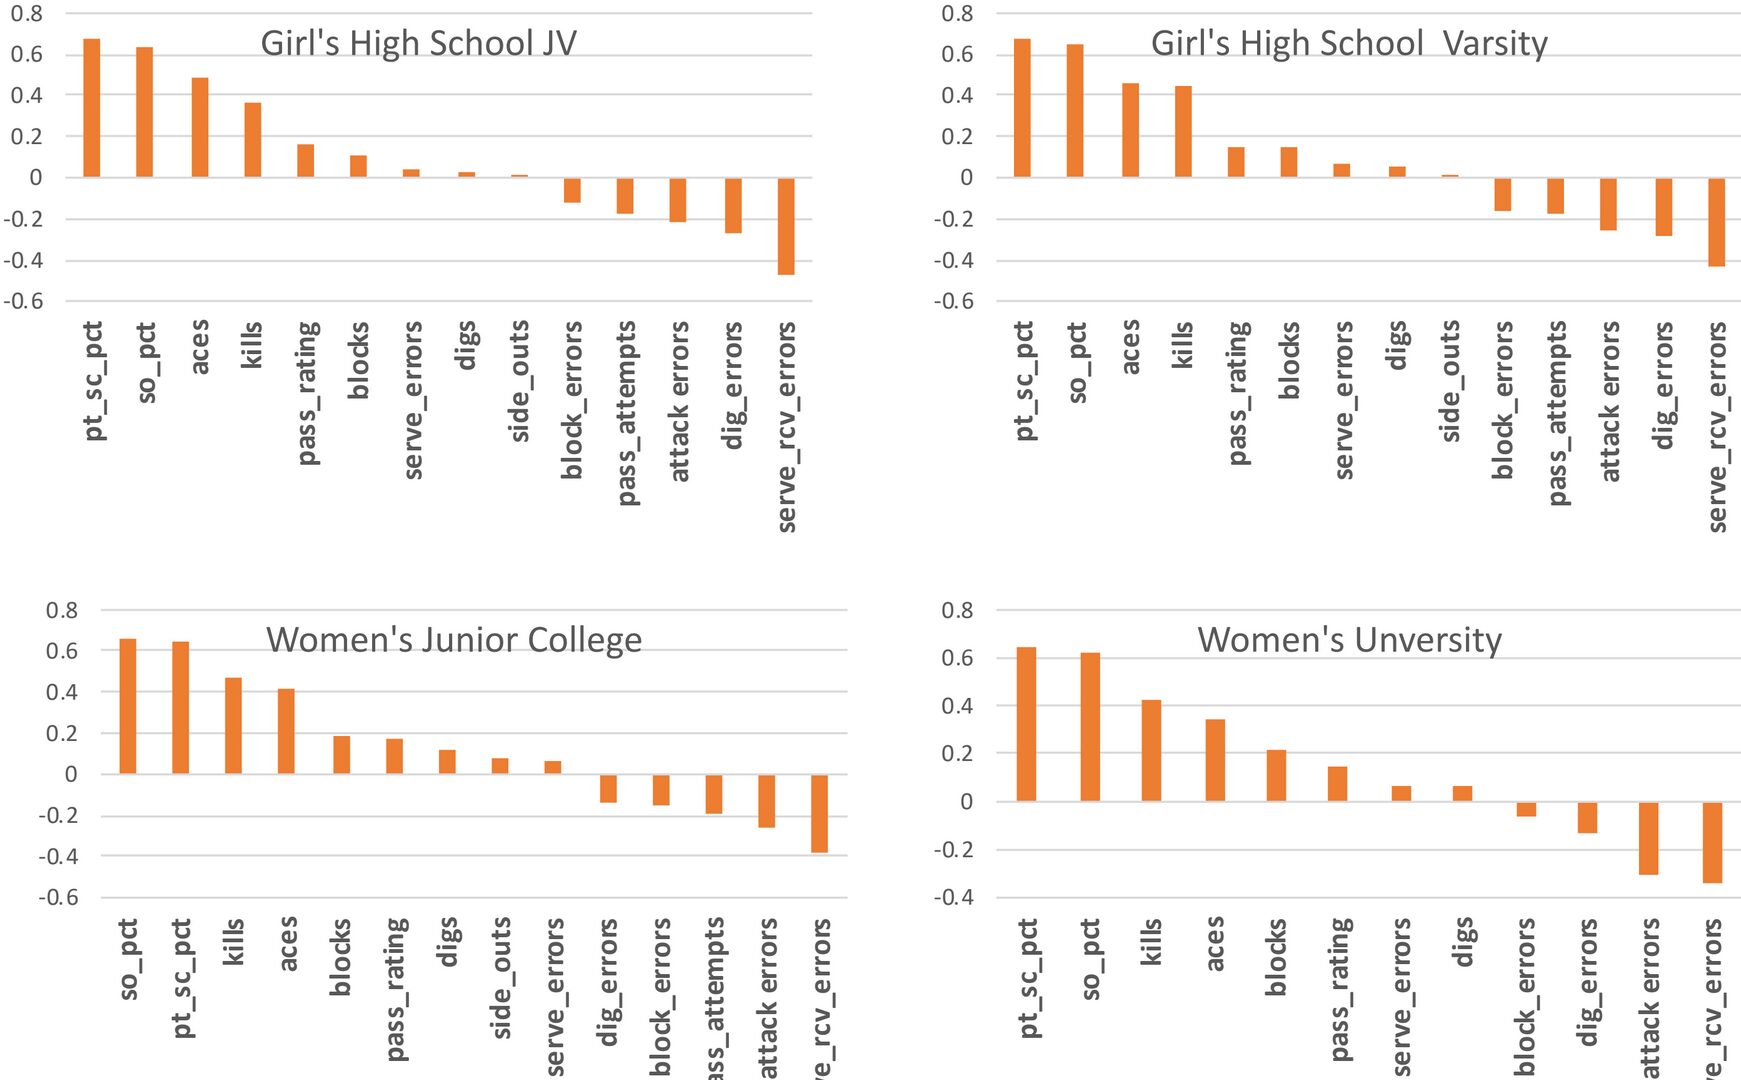
As you can see, Kyle went a bit broader than my analysis did. Yes, he has Aces, Kills, Blocks, and Digs per set. He also has errors/set for Serves, Blocks, Attacks, Digs, and Receptions (which is basically the other team’s aces). He’s got Point Scoring % (pt_sc_pct) and Sideout % (so_pct) as well. The former is when you win a rally as the serving team (also sometimes referred to as a break point) while the latter is winning the rally as the receiving team. You’ll also see figures for pass ratings and pass attempts (# of times the other team served). In some places there’s also the number of sideouts.
It’ll probably come as no surprise that the scoring % figures correlate the best to winning. And, of course, the error tallies mostly correlate negatively. The big exception there is service errors, which shows a small positive correlation. That speaks to the requirement for aggressive serving, especially noting that service aces ranks #3 or #4 in positive correlation.
Related to that, I doubt anyone’s surprised that Aces rank higher than Kills for the lower levels of play. We’ve all seen how much good serving can dominate there.
As I’ve written before, I don’t put much stock in the fact that blocks tend to not correlate highly with success. Good blocking isn’t just (or even mostly) about stuff/kill blocks. Similarly, a high dig tally can simply mean the other team is attacking you a lot. Potentially, that’s because you can’t score against them, giving them transition swings back at you.
What I suspect will surprise a lot of people is how low the pass rating correlates to winning. It’s 0.2 or lower in all four cases above. That’s because a good pass isn’t a point scoring event. It only potentially leads to a point being scored via a kill.
I encourage you to go check out Kyle’s analysis. There are some interesting takeaways.