

The term “reversion to the mean” or “regression to the mean” may sound complicated, but it really isn’t. In statistics the term mean is the same as saying average. Reversion or regression in this context just indicates moving back to. Put it all together and you get moving back to average. Pretty straightforward, right?
Why is this important for you to understand as a coach?
Because it speaks to how we react to players under- or over-performing. Even more, it speaks to the cause we link to the effect of a player doing better or worse in the future.
Let me use the following graph to explain.
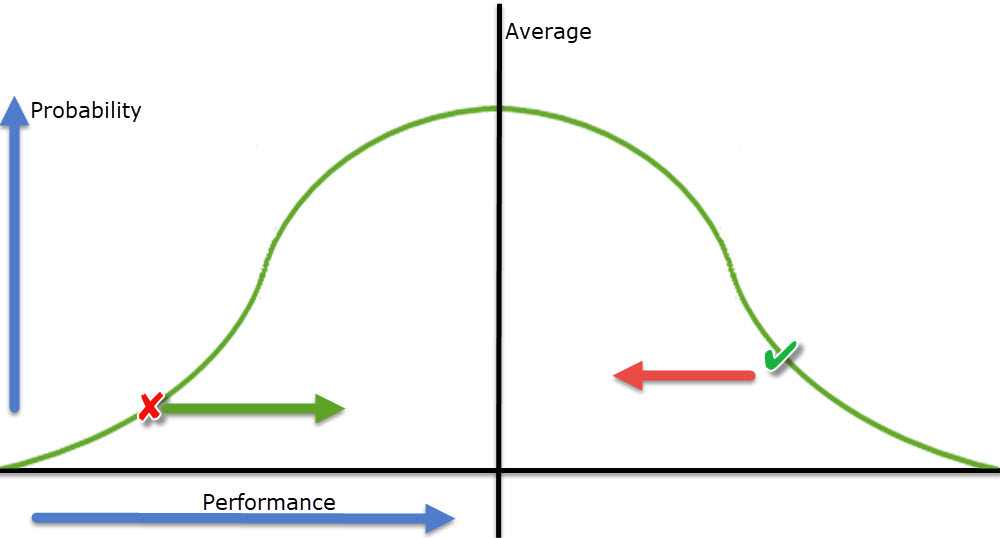
What you see above is a fairly typical bell curve. It indicates the likelihood of something. In this case, let’s think in terms of a volleyball player’s performance. The horizontal axis is performance from very bad to very good. The vertical axis is probability, from low to high. As you move along the bell curve line you get the odds the player performs at a given level. The odds are low that they perform either very poorly or very well, while the odds are relatively high that they perform somewhere around their average.
Here’s where the reversion or regression part comes in.
Look at the red X. That indicates a pretty bad performance, right? Notice I put a green arrow pointing to the right next to the X. Why? Because, all else being equal, chances are the player will do better in their next opportunity.
Similarly, you’ll see that I put a red arrow pointing left next to the green check mark at a pretty good performance point. Odds are the player won’t be as good next time.
Think about what all this means for how you react to the player. If they just had a bad performance and are probably going to have a better one next time out because the odds favor it, will you yelling at them or punishing them accomplish anything?
Flip that around. If the player just did very well and is probably not going to do as well next time, does it make sense to place too much weight on it?
And, of course, this all applies to teams just as much as individual players.
Here’s a video where John Kessel from USA Volleyball talks about this using a basketball analogy.
So chances are what we say or do is not the cause that leads to the effect of the player doing better or worse next time. Players and teams – especially young, inexperienced ones – are erratic in their performance. We don’t want to react to every single time they are better or worse than average. It’ll just give us whiplash.
All else not equal?
You’ll note that I said expectations of future performance were, all else equal, that they’d be somewhere around the average. That “all else equal” bit is important and is part of the side of coaching that’s likely more art than science. How you react to a player’s performance has to be linked to whether there is an underlying cause or not. If there is an underlying cause, then what you’re seeing actually reflects the player operating with a different performance distribution than their usual one.
Let’s say a player is sick, as an easy example. If a player is not feeling well then you will think of their expectations in terms of a “performance when sick” curve rather than the general one we’ve been talking about up to now. It features a distribution somewhat left of the usual one. Average performance in this case is probably going to be at a level that would be considered poor by the players’ normal standards.
There are, of course, lots of possible reasons why a player’s performance distribution curve could be temporarily shifted left of where it usually is. Part of your job as a coach is to try to find a way to get it shifted back. That’s not realistic with a sick or injured player, but if it’s one who’s distracted, lacking motivation, or something like that, then it’s something you can address.
From the opposite perspective, maybe a player performs better when mom is at the match. Their performance curve when she’s in attendance is to the right of where you normally see it. From a coaching perspective, you should then be looking at how you can make that shift permanent – aside from assuring Mom’s at every match, of course.
Coach induced shifts
If a player is just having an off day with no real cause, you could actually make things worse by yelling at or punishing them. If it negatively impacts their mood, focus, etc. then you just became the source of the kind of left shift in their performance distribution I talked about above. The same could possibly be true if you excessively praise a player for a good performance. They might start feeling the pressure of expectations.
There are, of course, players who do better after some sharp words to get their focus back, or when they know Coach is happy with how they’ve done. This is where knowing your players becomes extremely important.
Starters vs. Subs
It’s worth noting that generally speaking starters are the players with a higher mean level of performance. On average, they perform better than the non-starters. That’s why they are starters. This then ties in with the question of substitutions if a starter is under-performing or the team isn’t doing well.
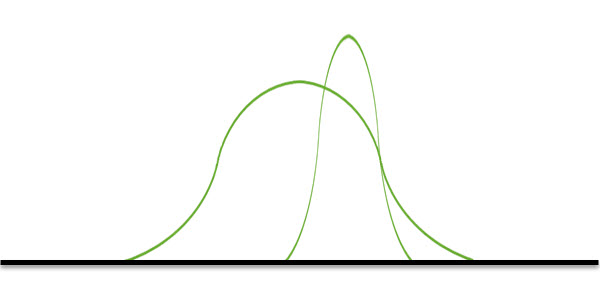
I should note that players don’t all have the same performance distribution shape. Here’s an example of three different distributions with the same average.

Notice you have the one we’ve been using up to now, which is the one with the 2nd highest peak. You can also see a higher peaked, but more narrow distribution. That indicates a very consistent performer. The last one is wider and flatter, which is what you’d see from a player with very wide performance swings. They can be exceedingly good, but also extremely poor.
Here’s something else worth looking at.
In this case we have players with different averages. The better one has that narrow, tall distribution of the very consistent player. The one with the lower average has a broader range of performance. Generally speaking, the one with the higher average will outperform the other. We can see, though, that there is a little part of the other player’s distribution that goes further to the right. That means sometimes, though not often, they will be the better player of the two.
Raising the mean over time
At the end of the video above John talks briefly about how the job of the coach is the raise a player’s (and team’s) average performance. This simple graph is a representative of that.
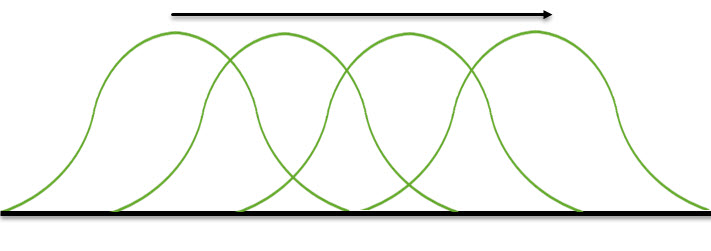
You can see in the diagram how the distributions progressively shift to the right. Remember, the horizontal access is performance, so this shows someone getting better over time. In fact, if you look at the right-most curve it does not overlap at all with the left-most curve. That’s a situation where on their worst day a player will do better now than they could ever have done in their initial situation. Think about an 18 year-old player compared to their 14 year-old self. Naturally, the rightward shifts in the performance distribution become smaller as the player gains mastery and experience.
Our job as coaches is, through training and other developmental work, to keep the player’s mean performance rising and/or narrowing their performance distribution (making them more consistent). How we most effectively do that is the subject of other conversations.
Timeouts
Mark Lebedew and others have provided research into the effectiveness of timeouts. Basically, they find little or none (sideout percentages after timeouts are basically the same as their average). This is another area of coaching where reversion to the mean is a possible explanation for what we think we see. And of course there’s also the question of confirmation bias, but that’s a different subject.
Note: If you want to learn more about the concept of reversion to the mean and other things related to how we humans incorrectly link cause and effect and otherwise trip ourselves up in our interpretation of things, Daniel Kahneman’s book Thinking, Fast and Slow is a good resource.